
Reading the Multipliers
Auditing machine learning models in Swift by inspecting coefficient arrays.


When a machine learning model finishes training it hands back a set of numbers that indicate how it’s making its decisions. In a linear model, these numbers are called coefficients. Consider them values a model adjusts to perfectly fit your data.
In Quiver, these parameters are returned as a plain, native Swift array that you can print and inspect directly. In this article we will learn how to read these numbers and use them to understand what your model has learned.
What is a coefficient
A coefficient is simply a multiplier that represents a rate of change. It answers the question: “If I increase this input by 1 unit, how much will the prediction change?”
Imagine you train a model to predict house prices based on their square footage. If a model settles on a coefficient of 110.0, it means the algorithm calculates each additional square foot adds roughly $110.00 to the house’s value.
Under the hood
Beyond raw arrays of numbers, Quiver can translate your model’s settings into a standard algebra formula string using .asExpression(). Let’s train our LinearRegression model and then compare its coefficient with polyfit:
In Plain Terms: Polyfit
The polyfit function fits a curve to your data by finding the best polynomial of a degree you choose. A polynomial is just an algebra expression like 110x + 38000 (a straight line) or 2x² + 3x + 1 (a curve). At degree: 1 it does the exact same job as LinearRegression. Since we are writing this in Swift, the return value is an optional, so we unwrap it safely with if let.
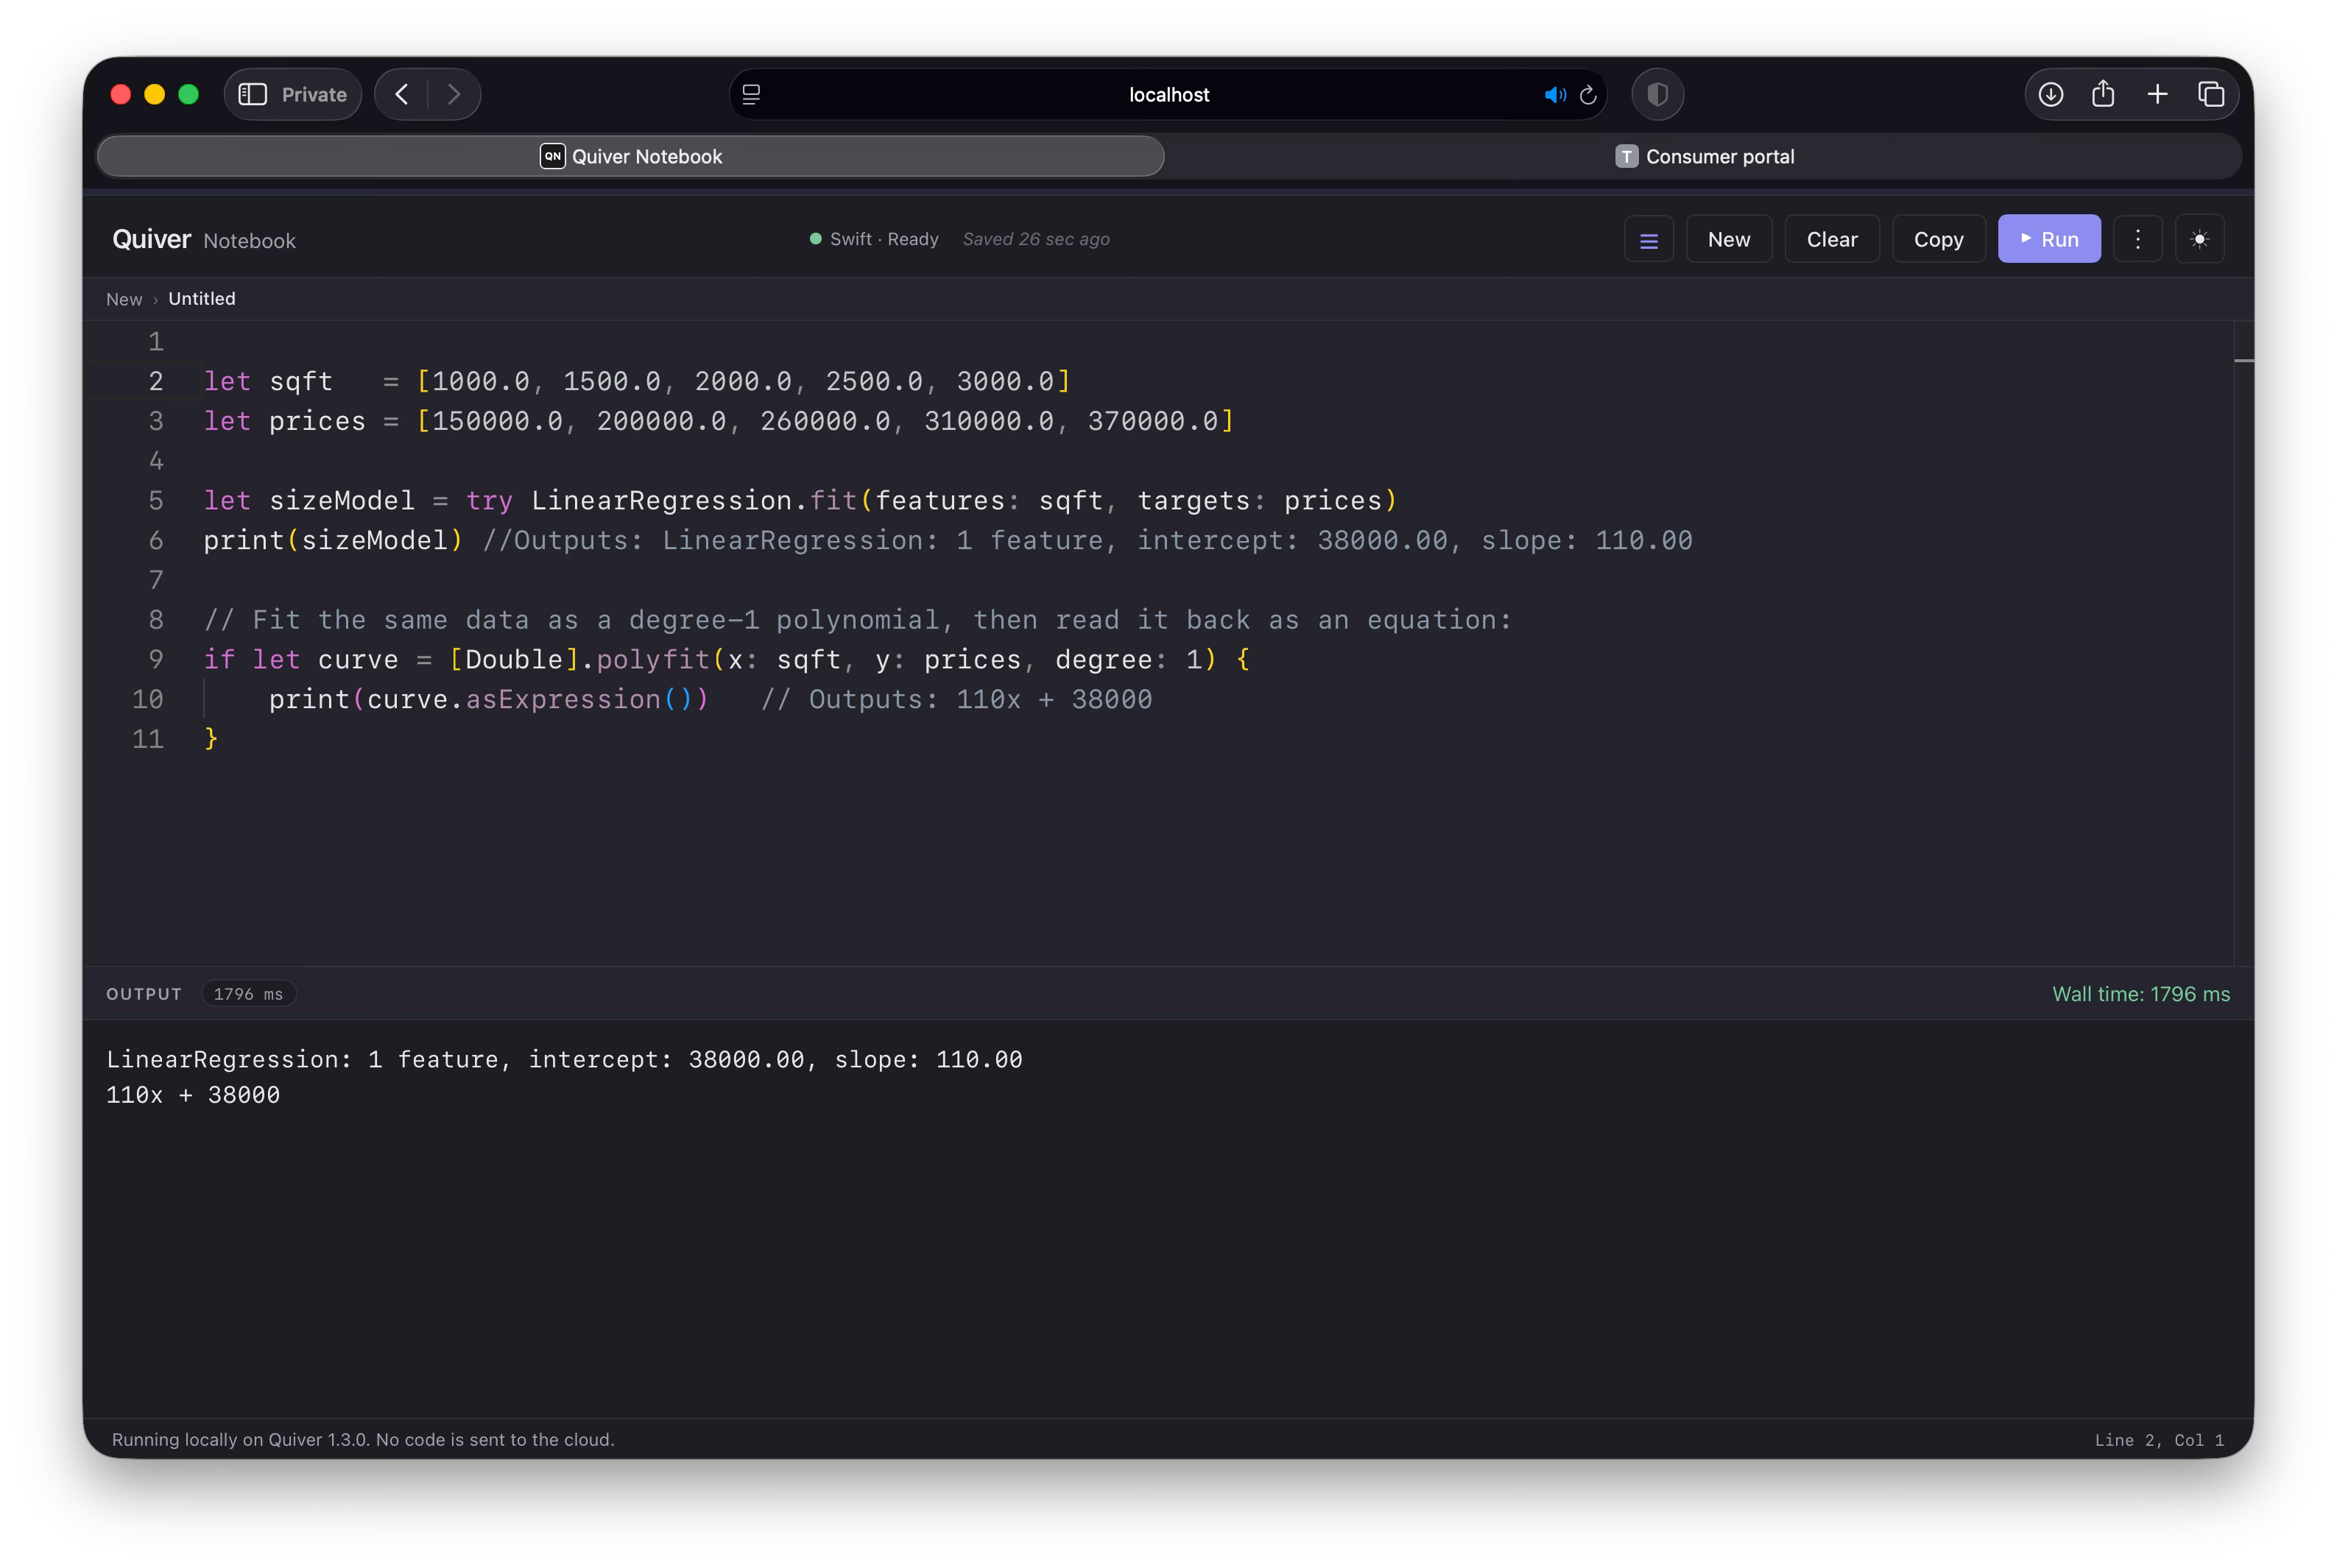
Notice the two results agree. The model’s intercept: 38000 and slope: 110 are the very same 38000 and 110 in the equation 110x + 38000. This highlights an important objective of machine learning: our models are searching for the best math equation to connect our inputs (x) to outputs (y).
Interpreting the numbers
To read our model’s coefficients accurately, we need to evaluate their layout, scale, and redundancy.
The layout rule
Quiver arranges coefficients using an intercept-first rule. The intercept (sometimes called the bias) is the model’s baseline starting point. It represents what the model would predict if every single input feature were exactly zero. Represented as a linear model, this is where a line would cross the y-axis. For our house price model, the coefficient array looks like this:
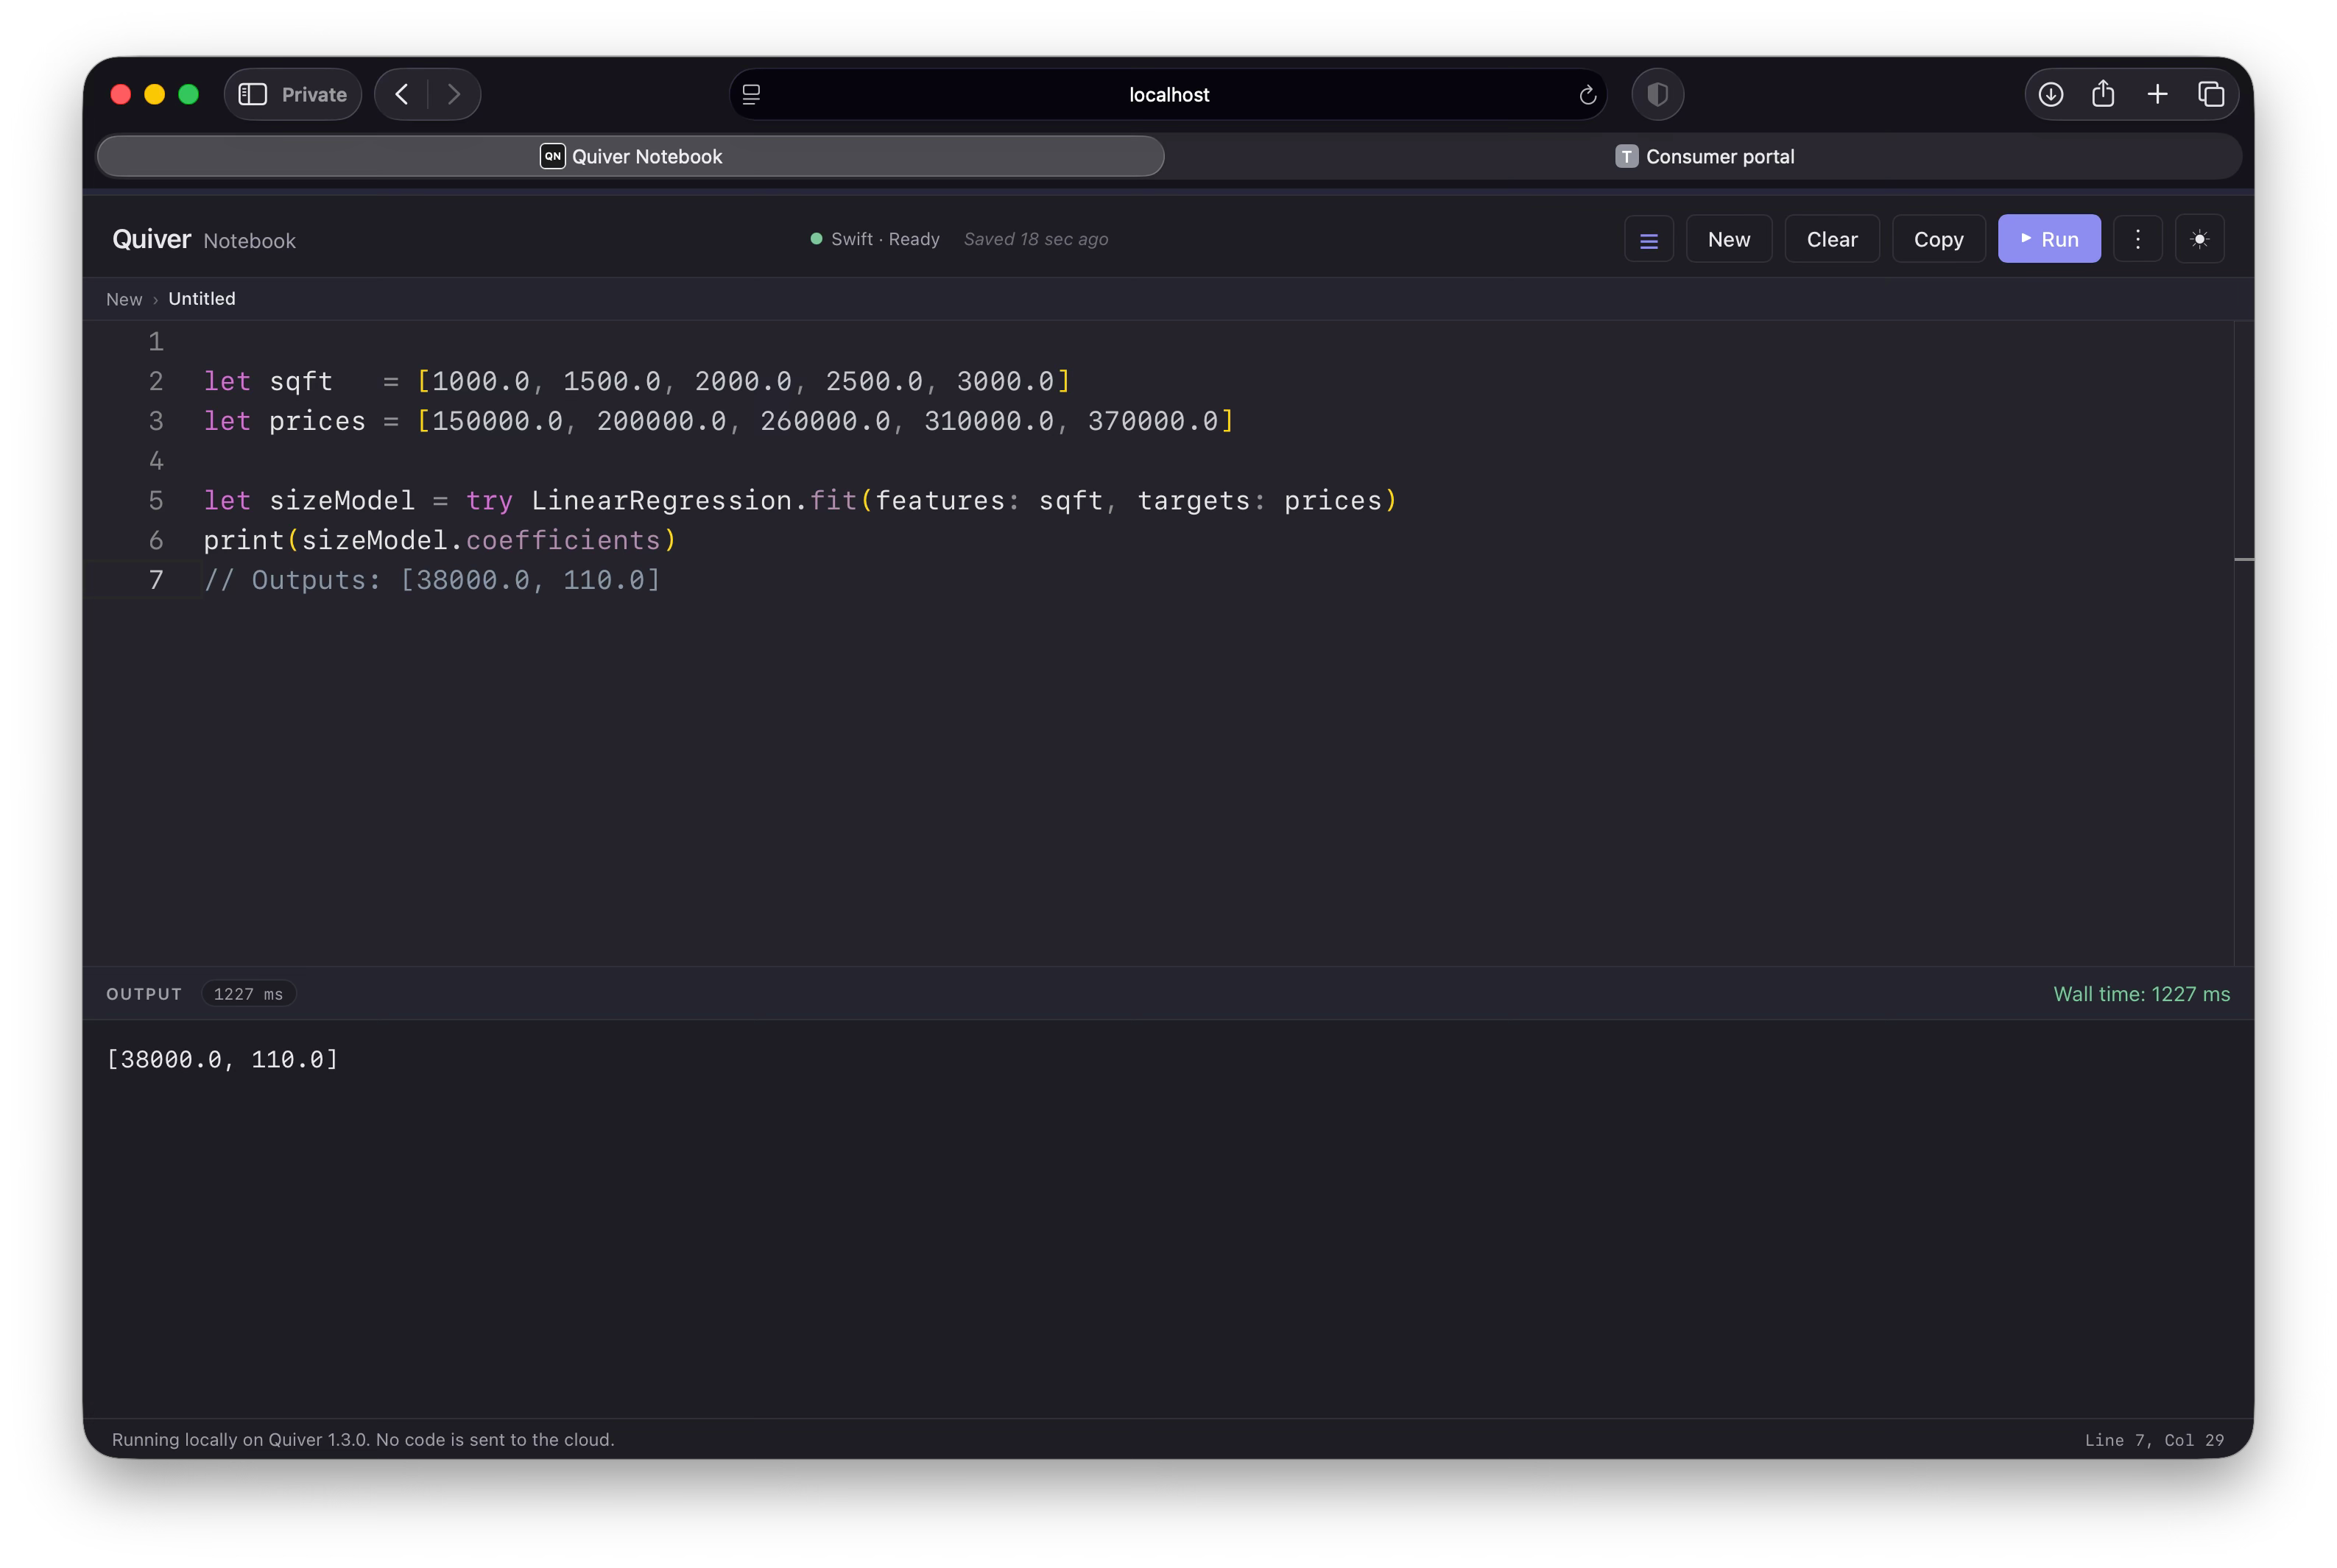
The baseline intercept, 38,000, means the model starts its calculation at $38,000 even if a house has 0 square feet, representing the base cost of raw land. The slope multiplier for square footage is 110.0.
The scaling rule
If you feed raw numbers straight into a model, the coefficients will match those native units. This creates a big problem if your features use wildly different scales. For example, let’s see what happens if we try to predict a house’s price using square footage (numbers in the thousands) and number of bedrooms (numbers from 1 to 5):
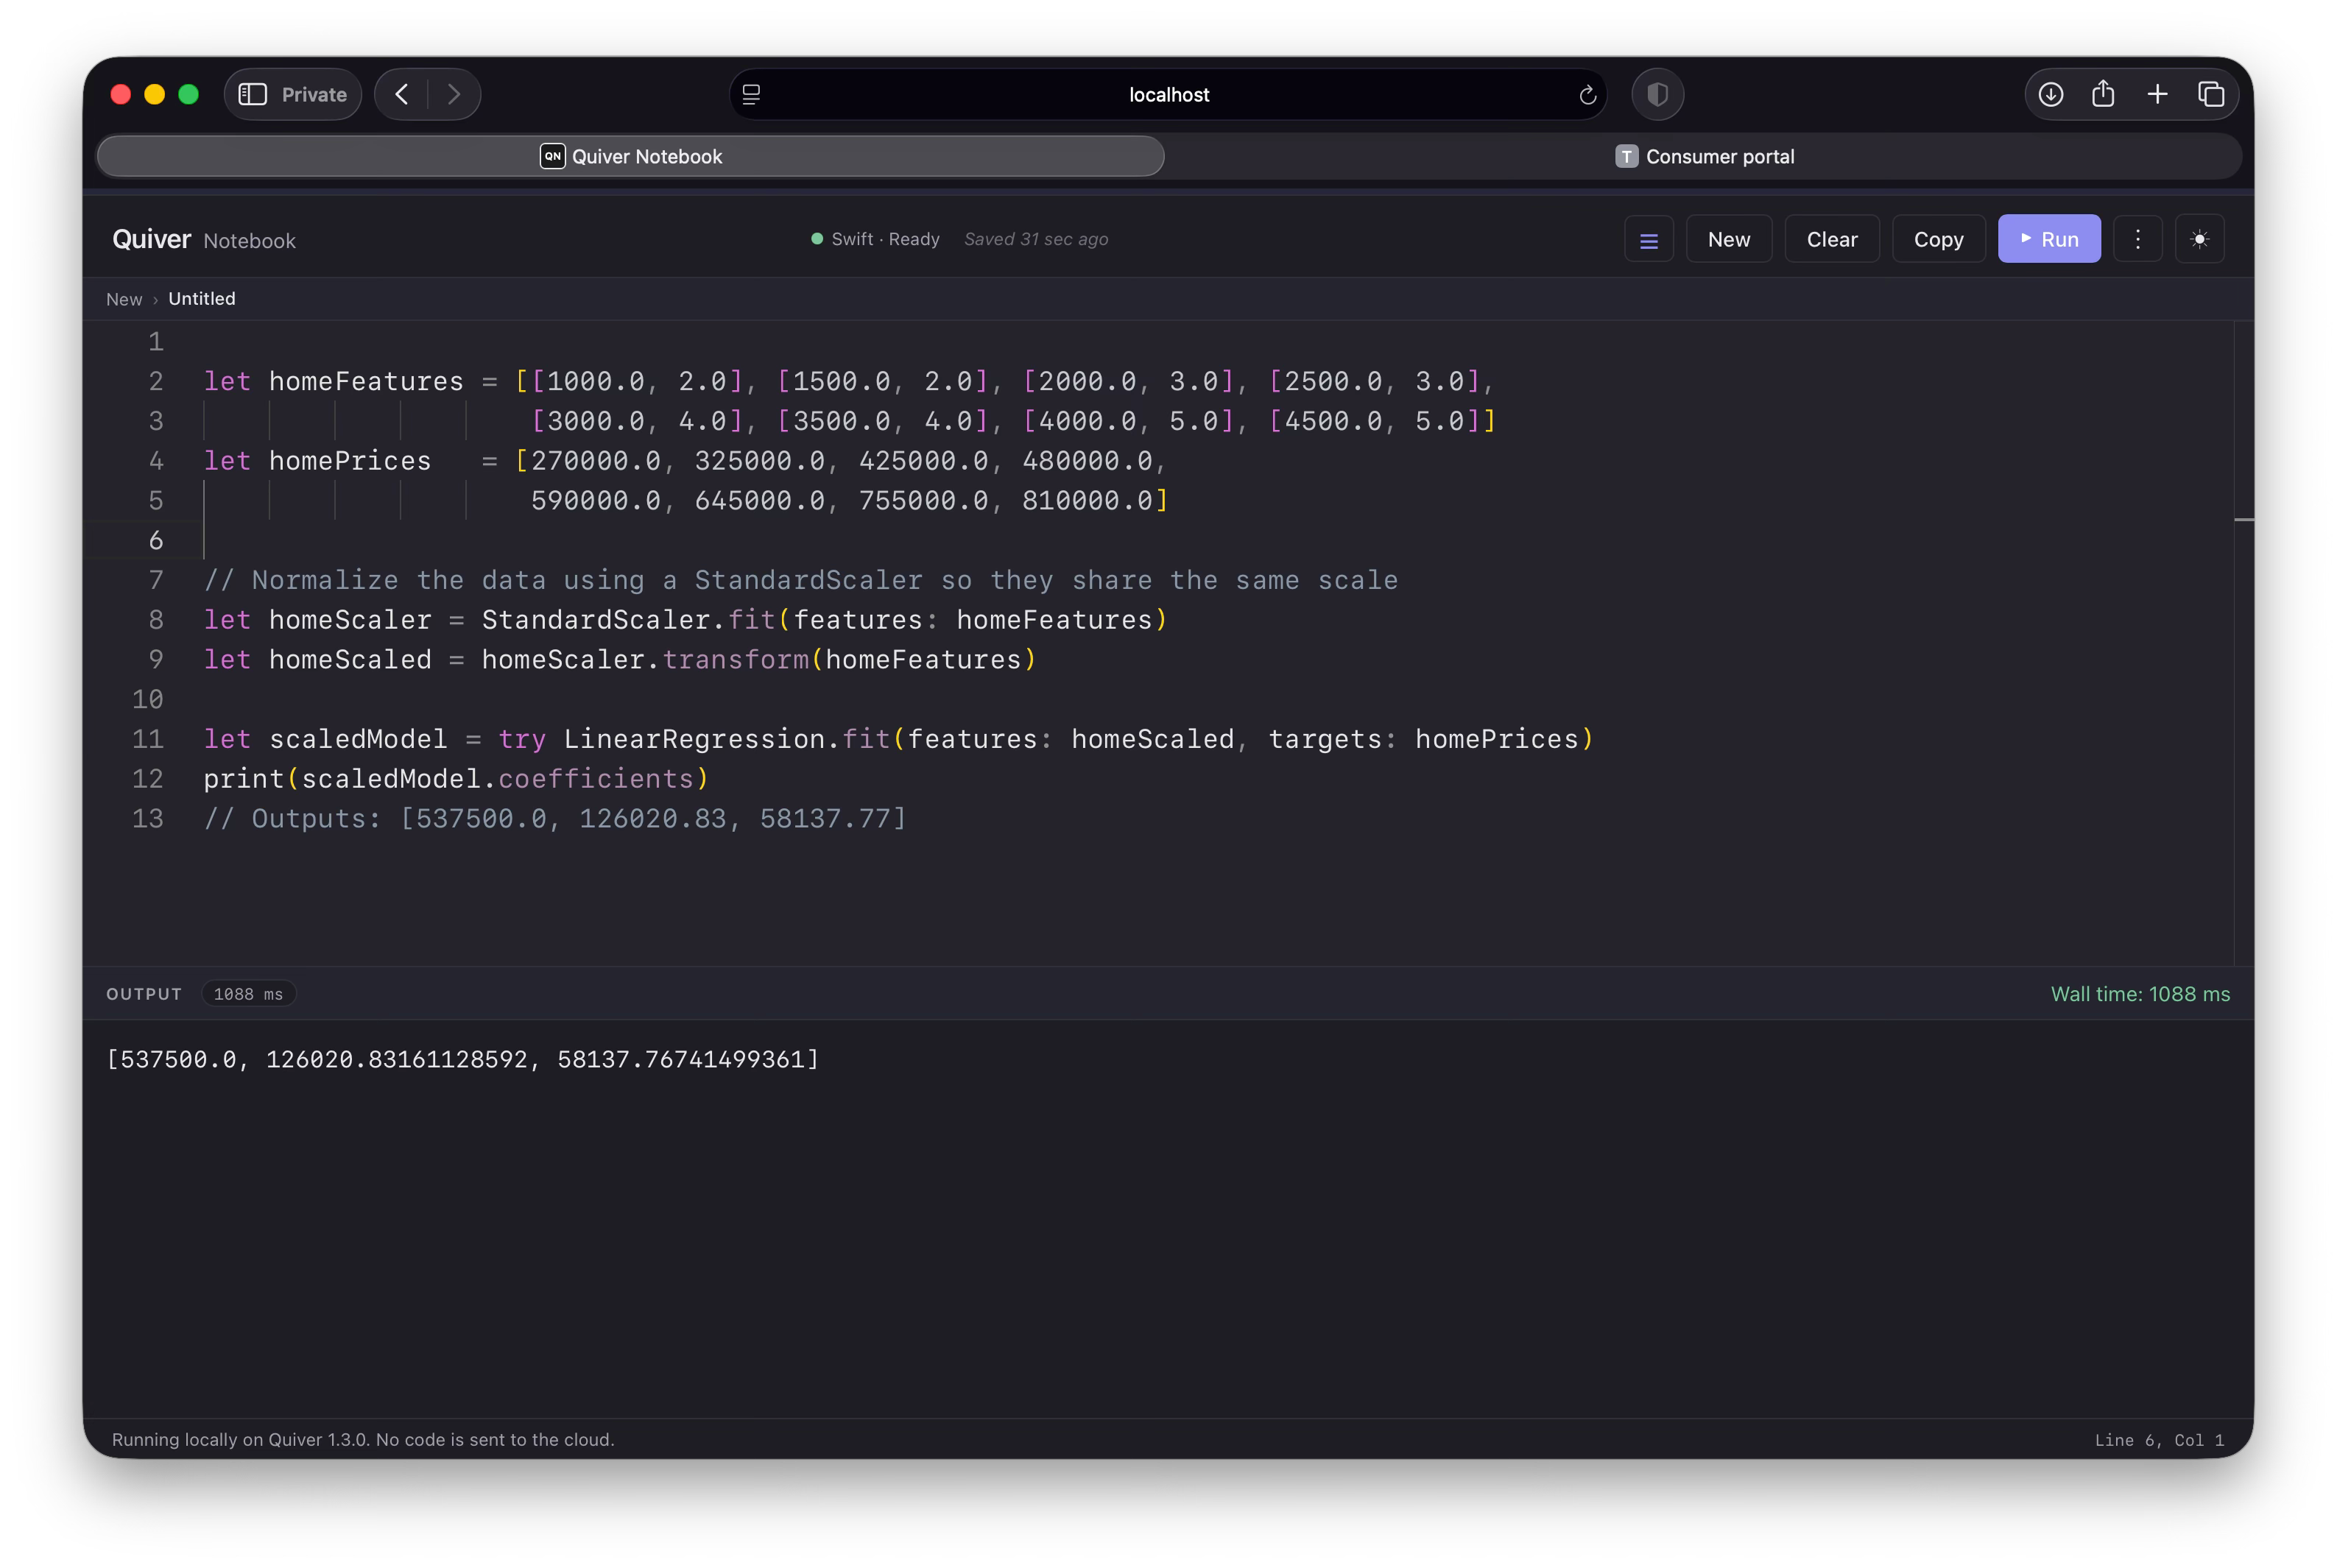
Our conclusion is that square footage moves the price needle far more than the number of bedrooms.
The collinearity rule
As seen, coefficients are transparent but can break if you feed the model duplicate or highly redundant information. This is called collinearity.
The near-duplicate trap
Imagine you accidentally include house size twice: once in square feet and once in square meters. Since these two columns are closely aligned, the math behind the fit grows unstable, and the solver can no longer tell how much of the price each column is responsible for.
Quiver measures this directly with the condition number, a single value that says how trustworthy a fit will be. When your features are independent it stays small — a healthy number in the low tens. As two columns start to copy each other it climbs, and once it reaches the thousands the fit is on unstable ground. We can read it straight off our scaled feature matrix:
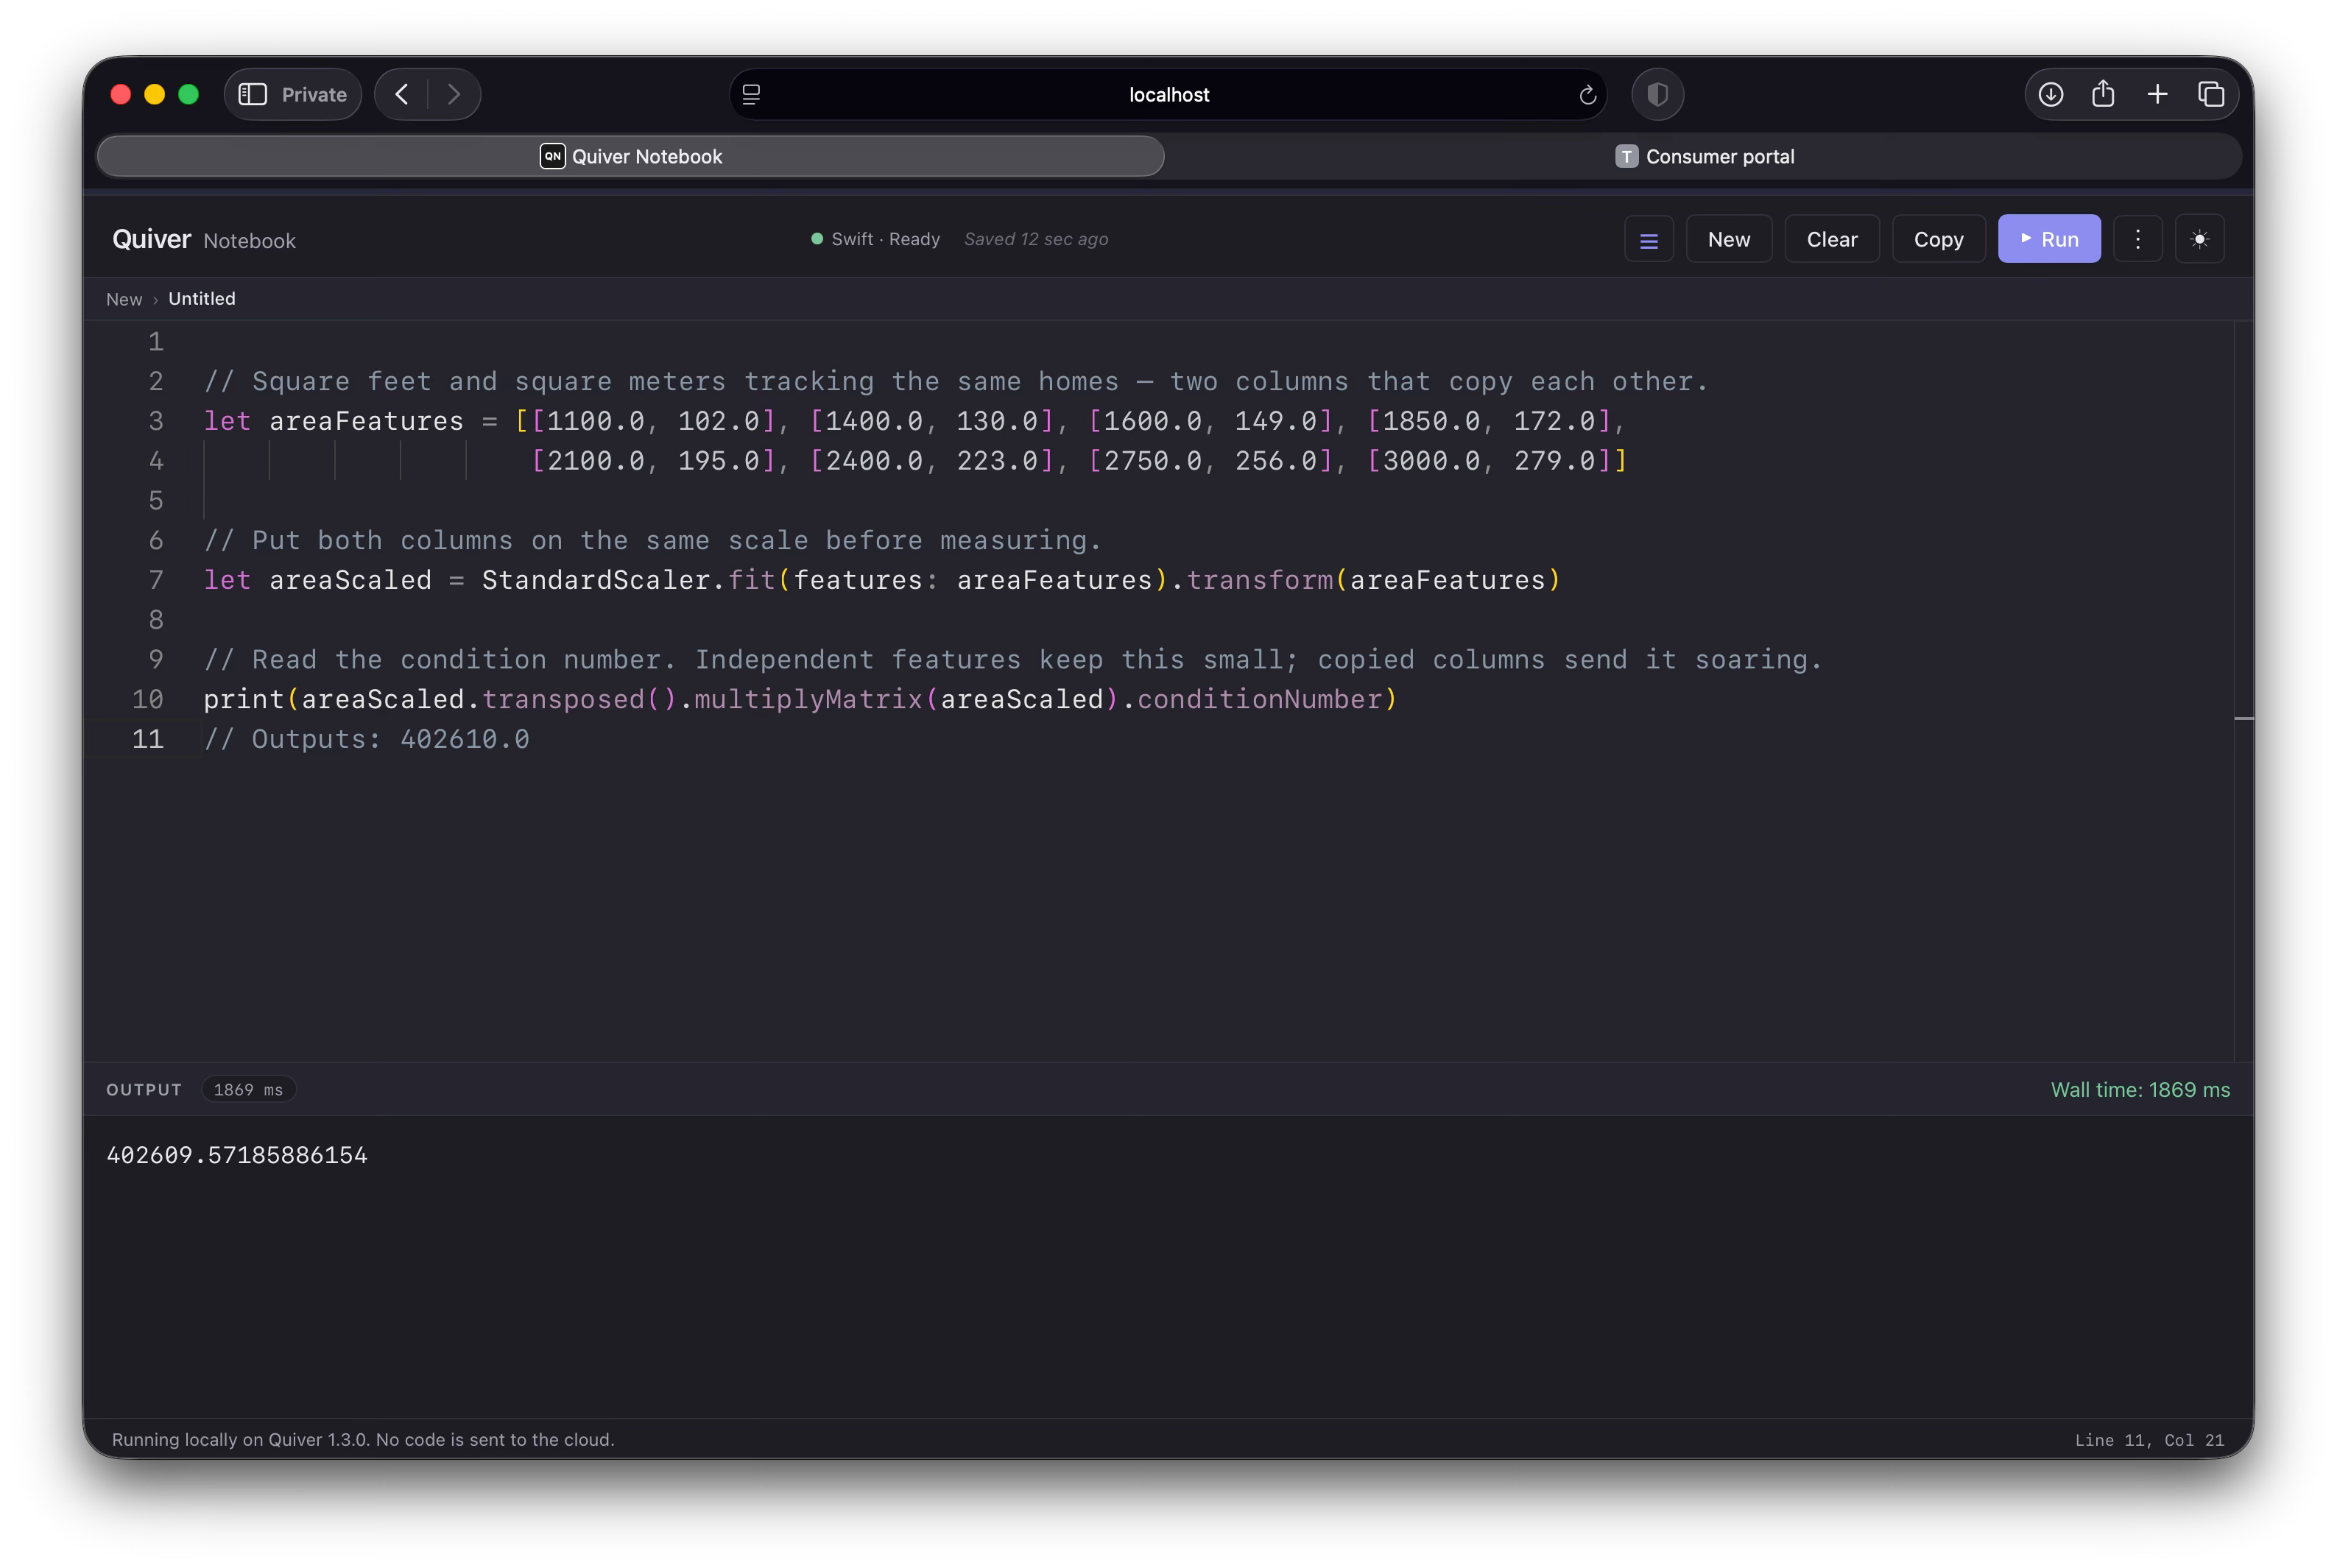
A condition number in the low tens is fine; at 402,610 these two columns are nearly indistinguishable to the model. When columns become perfectly identical the number climbs to infinity and there is no unique answer at all, which is why we wrap the fit in a try/catch: Quiver throws rather than hand back a number it cannot justify.
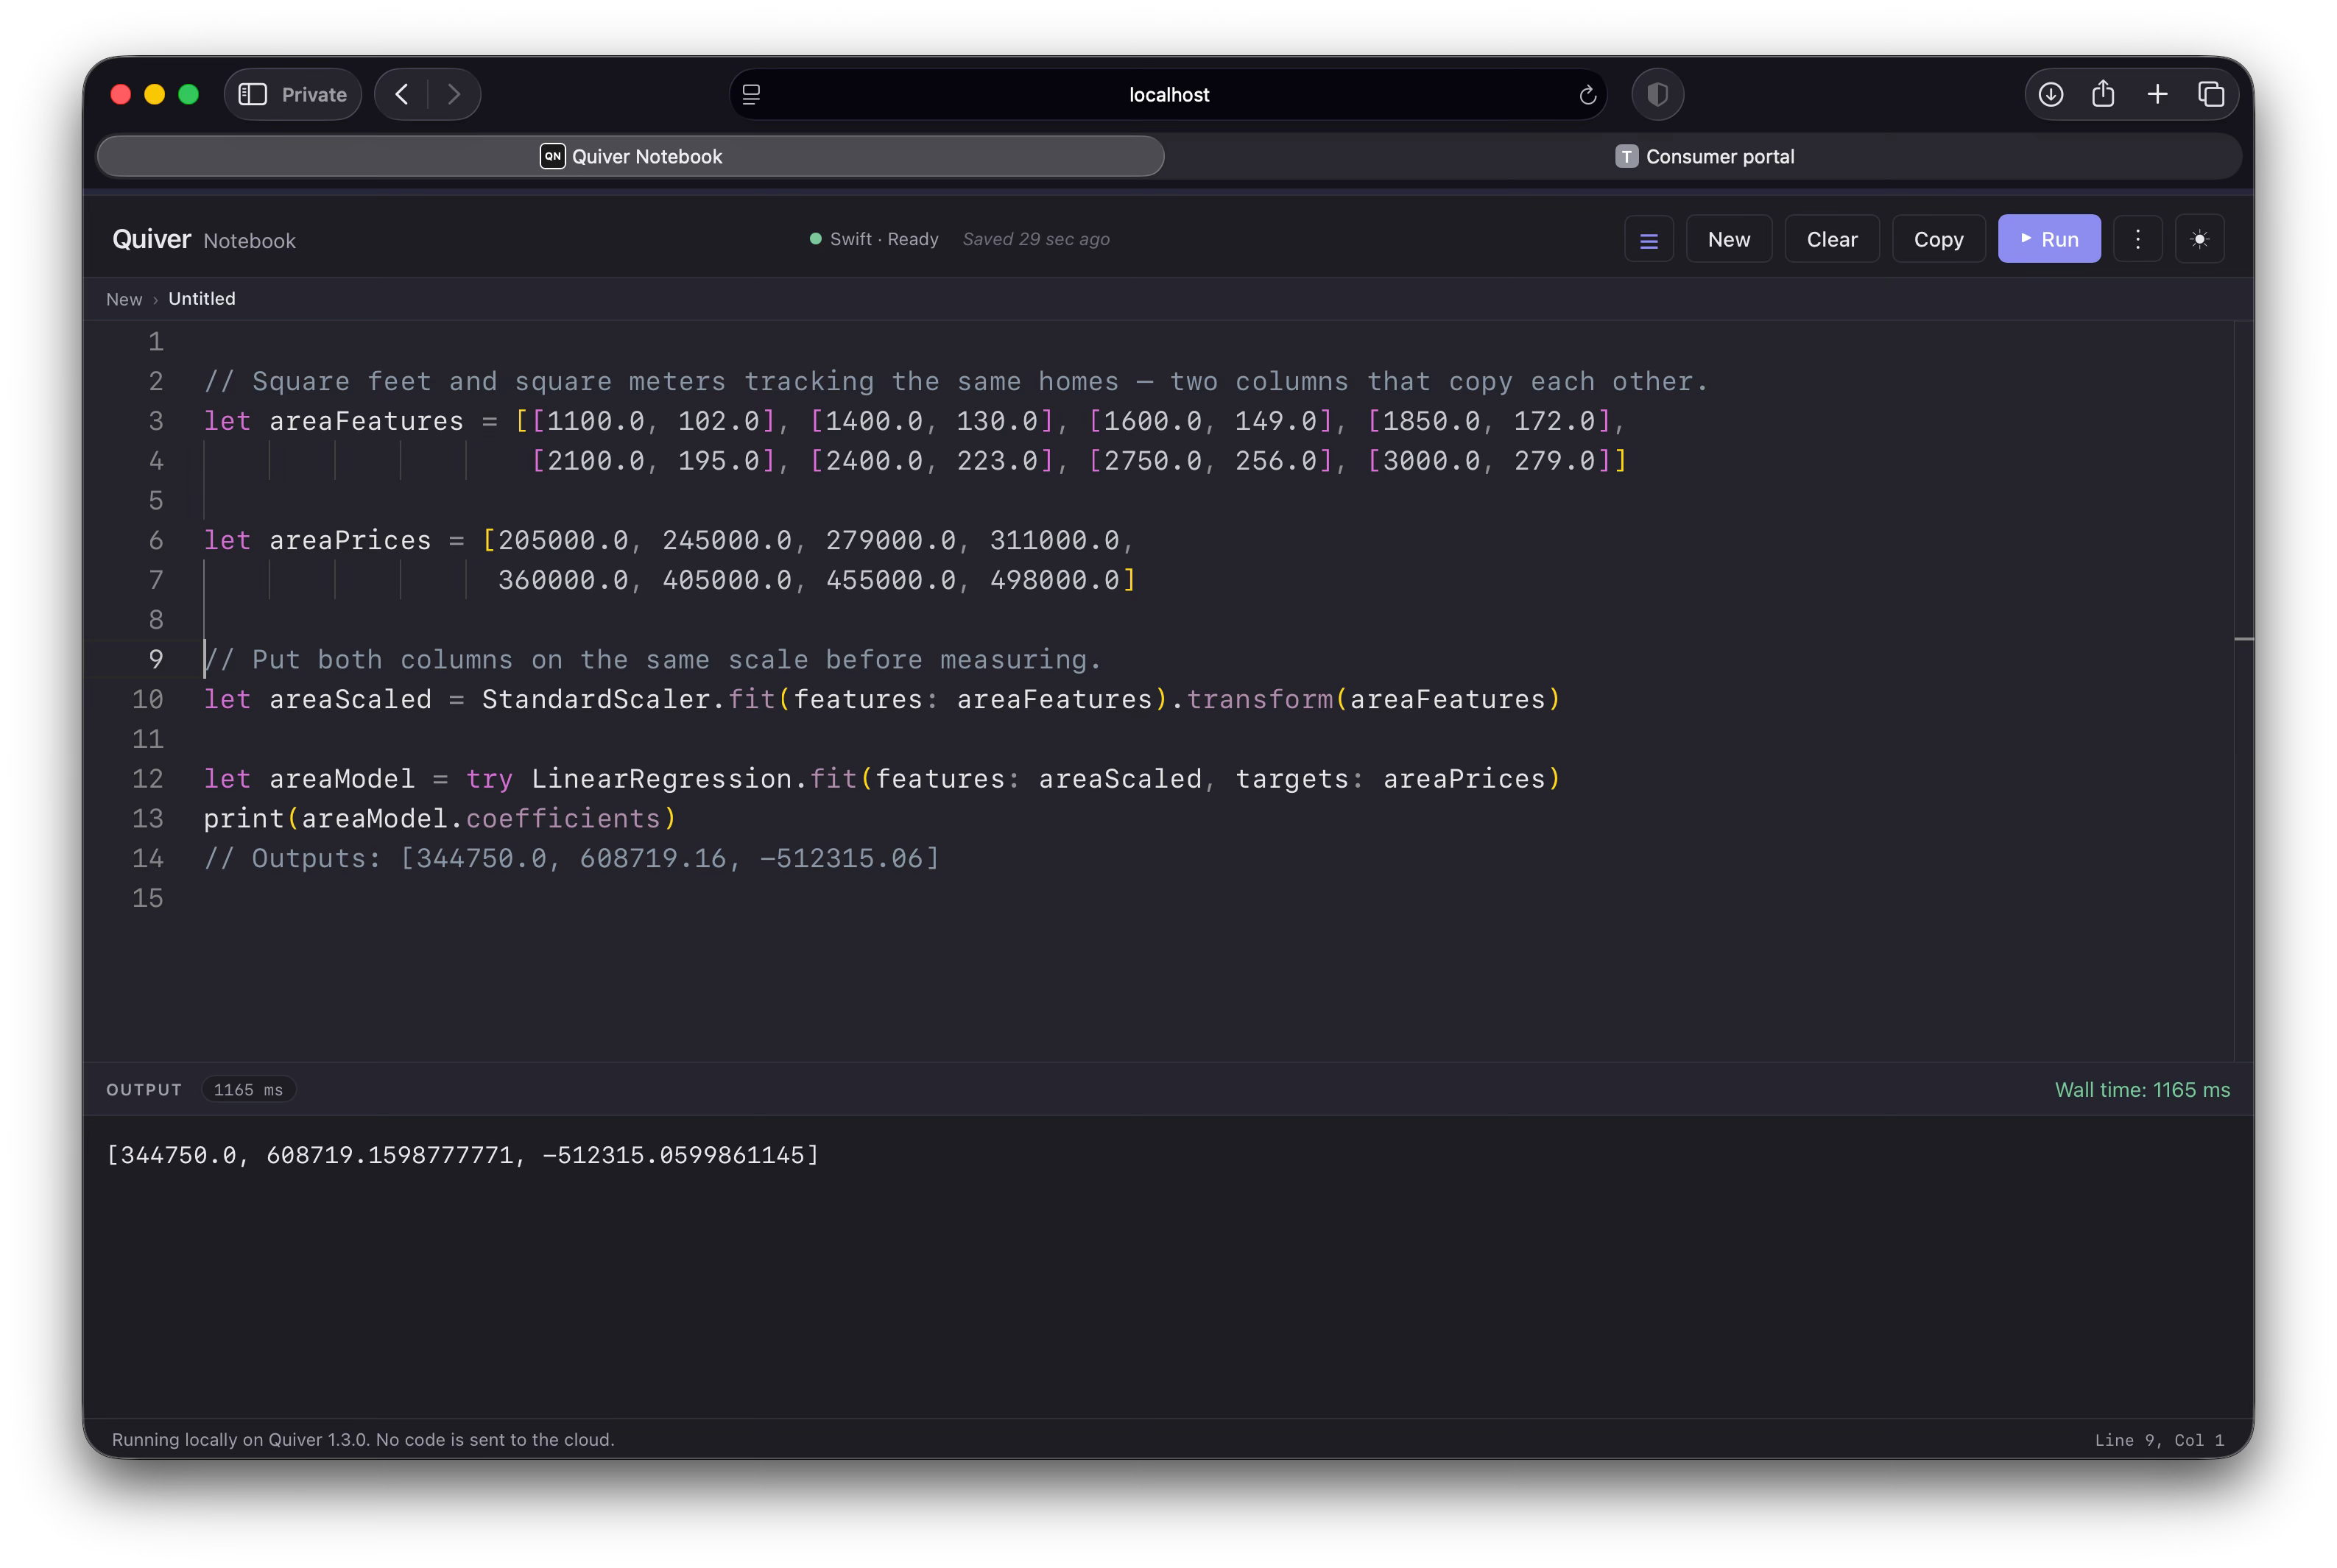
Wow, the weights have ballooned into absurd, lopsided numbers (608719 and -512315). The model is confused by the redundancy. The fix is to delete one of the duplicate columns and retrain.
The redundancy rule
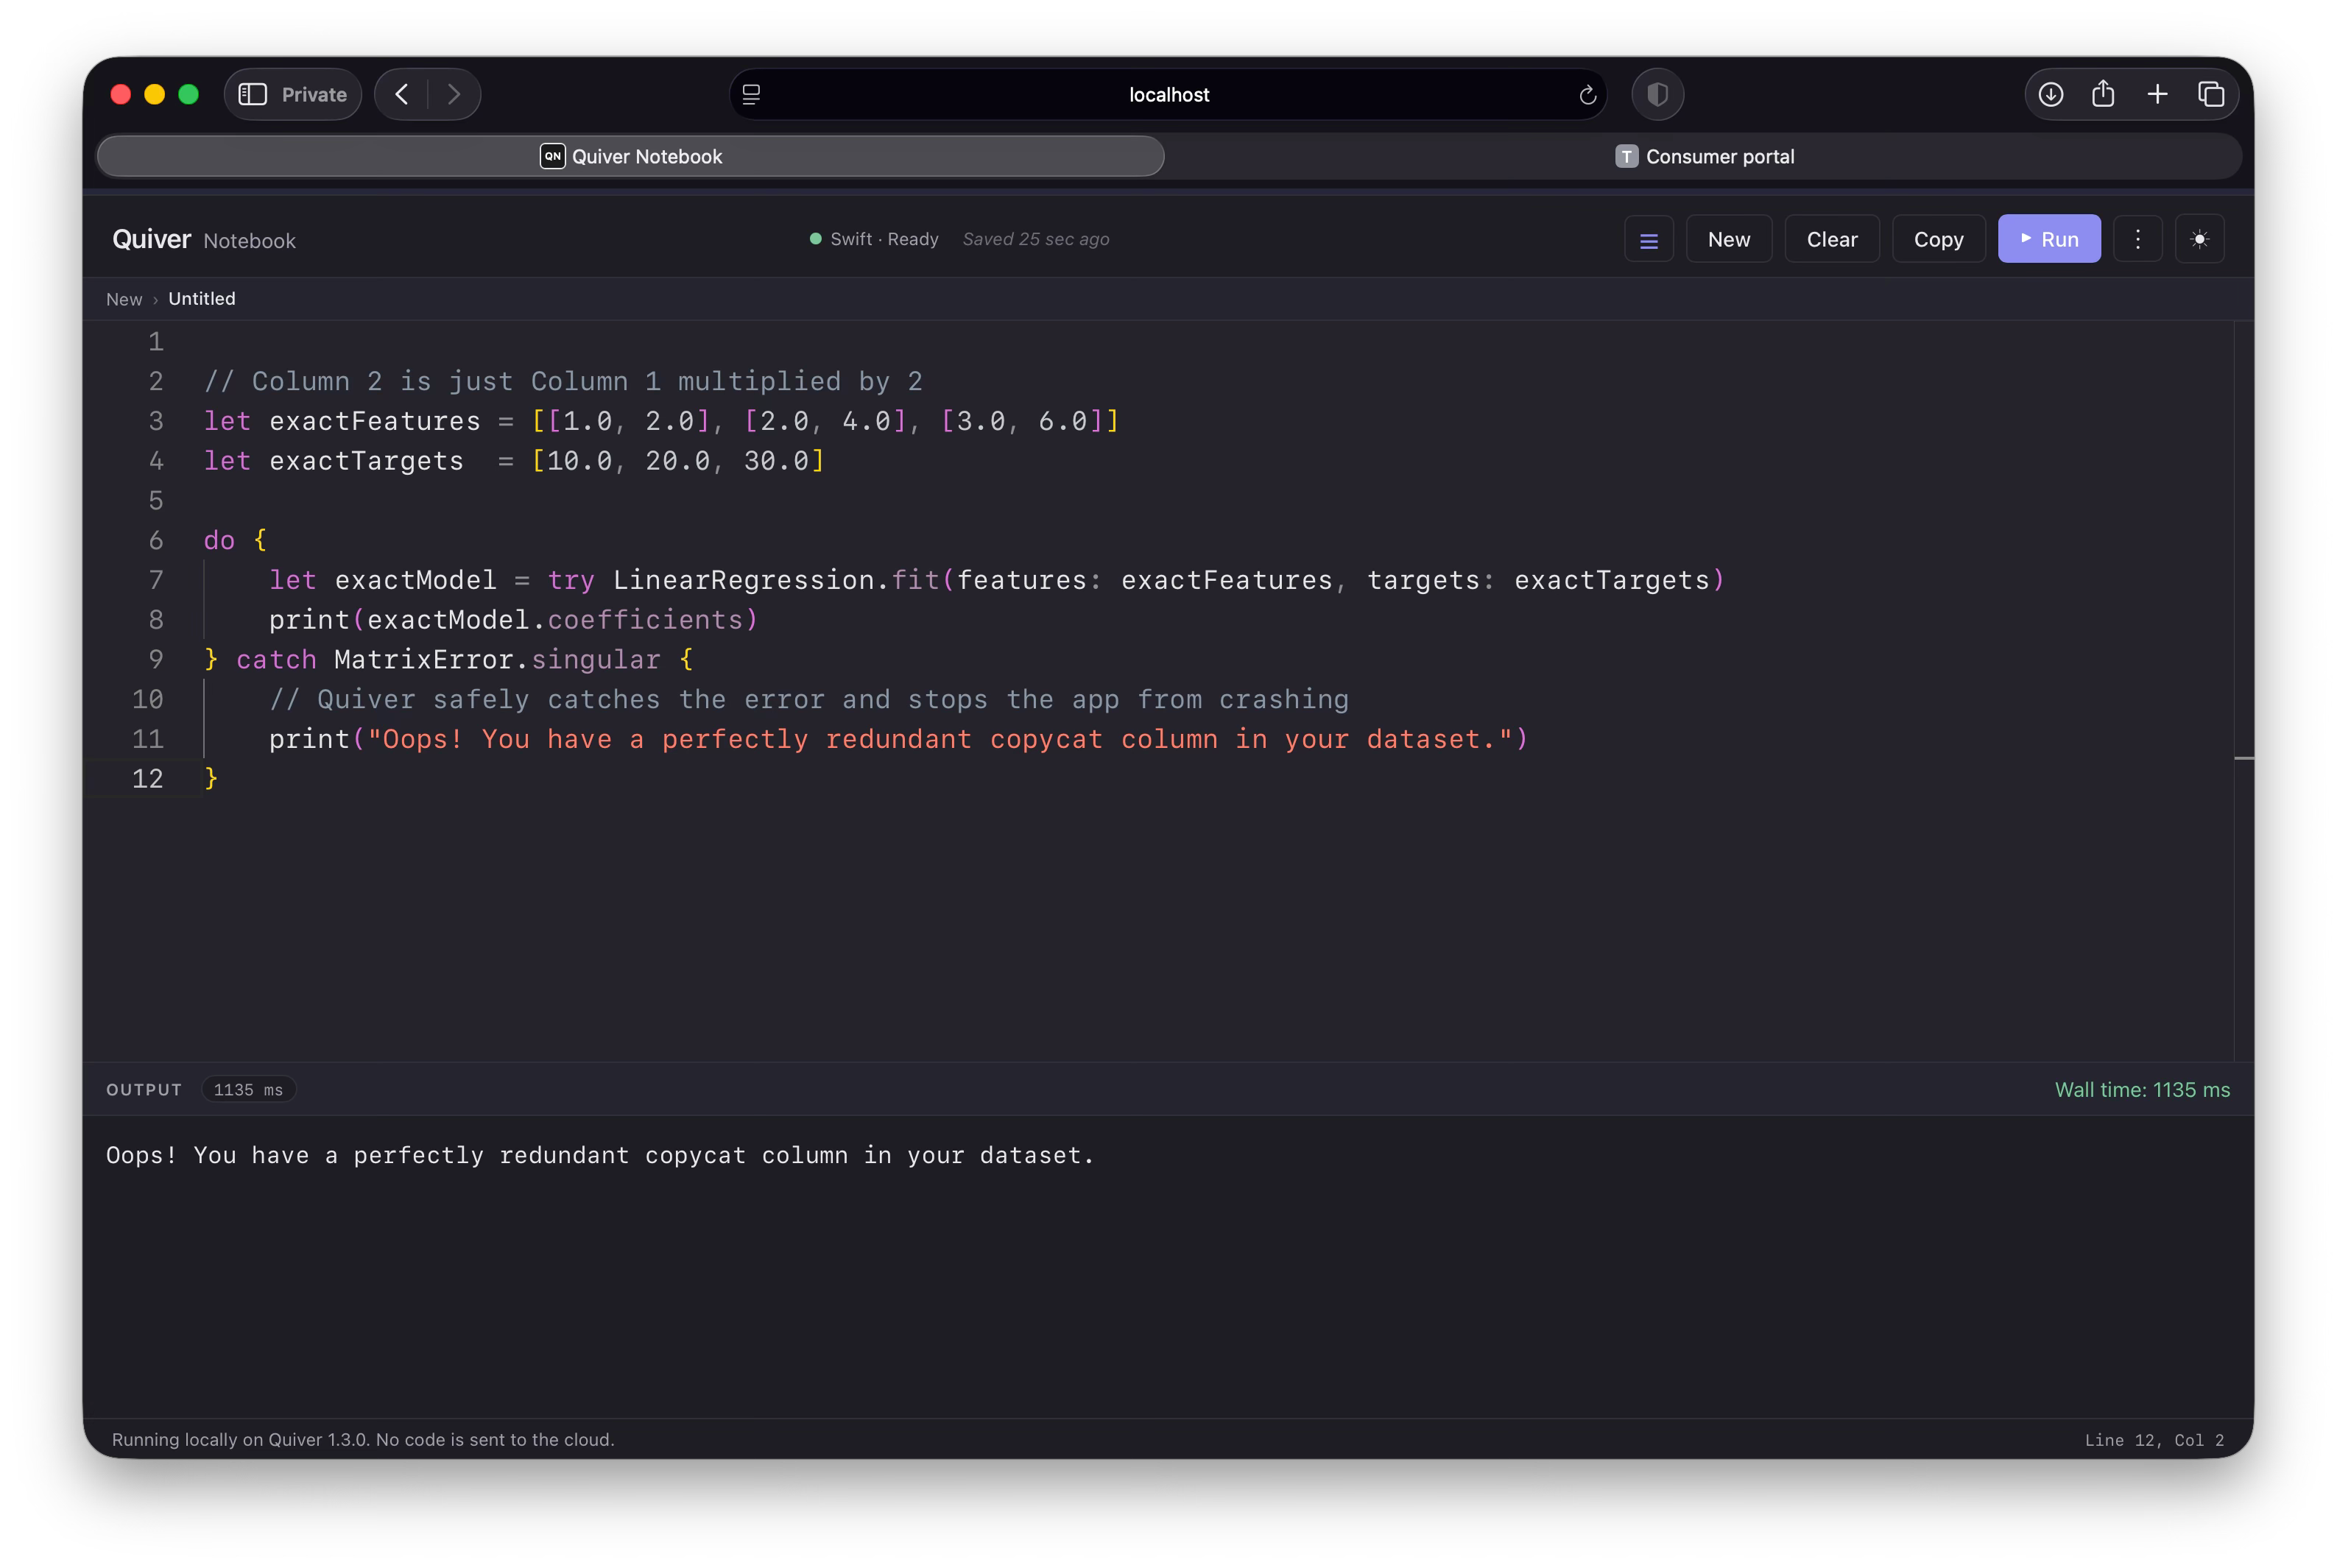
If one column is an exact mathematical copy or multiple of another, the underlying matrix math breaks completely because a unique solution is mathematically impossible. Quiver protects your app from crashing by throwing a clean MatrixError.singular exception that you can catch safely:
Further Reading
Training an ordinary least squares regression model.
Normalizing feature columns before classification with StandardScaler or FeatureScaler.
Curbing overfitting by adding a penalty that shrinks coefficients toward zero.
Shrinking regression coefficients with a penalty that curbs overfitting.